Week of November 9–15, 2026 · Central Okanagan Real Estate
14 Residential Weeks Available · Graham Real Estate
November 9–15, 2026 — Holiday week, a fall market still clearing at a discount.
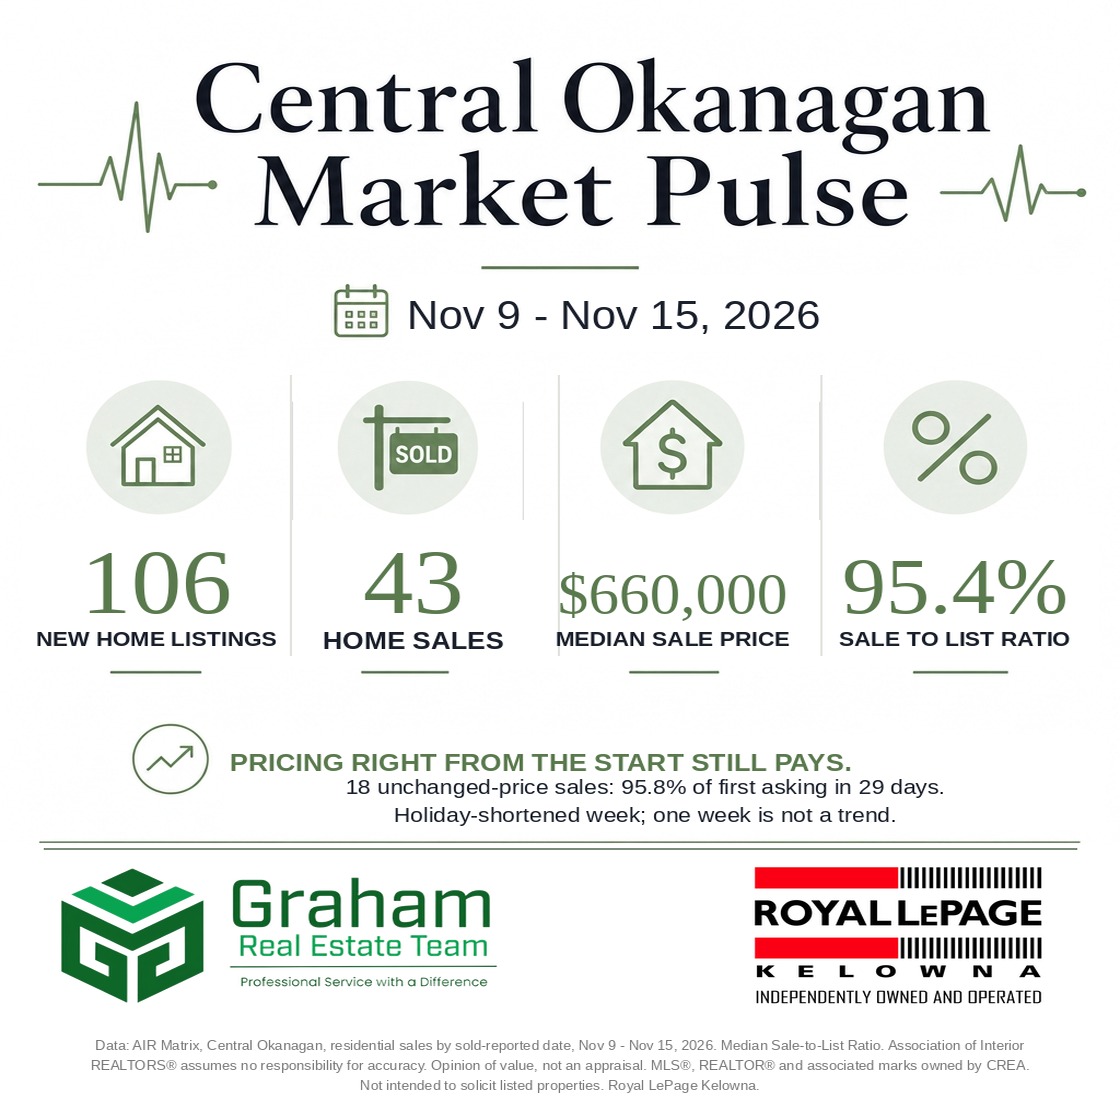
43 home sales and 106 new home listings. Remembrance Day shortened the working week, while homes typically sold at 95.4% of their last asking price and 93.5% of their first.
Remembrance Day on Wednesday, November 11 cut the working week to four days. We should not read the lower sales count as a trend.
The stronger signal is price: homes sold at about 95% of their last asking price and about 93.5% of their first. About two in three listings that left the market this week left without selling.
Residential figures only. Median days on market refers to this listing; cumulative days include listing history. Cancelled includes cancel-and-relist. Non-sale rate is expired plus cancelled divided by sales plus expired plus cancelled. Sales ÷ new listings compares activity in the week, not the same group of homes. Pricing groups describe sold homes only, not the prospects of every listed home.
- Home sales
- 43
- Average sale price
- $828,000
- Sale-to-List Ratio
- 95.4%
Holiday-shortened week
Median sale price $660,000
Median residential result
Residential sales · Pricing matters
Priced right. Or reduced later.
Priced right from day one
18 homes
95.8%
of original asking price
29 days to sell
Needed a price cut
25 homes
90.6%
of original asking price
115 days to sell
- At about 95.8%
- $670,600
- At about 90.6%
- $634,200
$36,400 difference · 86 extra days
Illustration only, not a forecast or valuation.
Comparison notes
Using this week’s rounded residential group results. Typical means the middle value. Different homes sold in each group; pricing alone does not explain every difference.
Residential sales · By price
Where buyers bought
43 home sales this week
- Under $500,000
- 11
- $500,000–$750,000
- 19
- $750,000–$1 million
- 5
- $1–$1.5 million
- 4
- $1.5 million and up
- 4
The market by home type
How much choice buyers have right now
Latest complete month: loading. More than six months of inventory generally means buyers have more choice and time.
—
Latest monthly figures
—
Latest monthly figures
—
Latest monthly figures
Residential homes only. Median means the middle value. Sale-to-List Ratio and sale-versus-original-list figures are medians of individual sale ratios. Days on market and cumulative days are different measures.
14 stored residential weeks. Holiday context matters.
Remembrance Day shortened the working week. The stronger signal is pricing: 95.4% of last asking and 93.5% of first asking.
Observed residential weeks only; missing weeks are omitted, not filled in. October new-listing figures are approximate.
| Week | New Listings | Sales | Unsold | Non-sale rate | Expired | Cancelled | Sales ÷ new |
|---|---|---|---|---|---|---|---|
| Jul 27–Aug 2 | 206 | 120 | 168 | 58% | 70 | 98 | 58% |
| Aug 3–9 | 161 | 89 | 90 | 50% | 23 | 67 | 55% |
| Aug 10–16 | 193 | 83 | 117 | 59% | 45 | 72 | 43% |
| Aug 17–23 | 184 | 85 | 125 | 60% | 37 | 88 | 46% |
| Sep 7–13 | 220 | 81 | 96 | 54% | 25 | 71 | 37% |
| Sep 14–20 | 202 | 76 | 111 | 59% | 39 | 72 | 38% |
| Sep 21–27 | 166 | 66 | 94 | 59% | 21 | 73 | 40% |
| Sep 28–Oct 4 | 173 | 64 | 212 | 77% | 115 | 97 | 37% |
| Oct 5–11 | ~175 | 58 | 95 | 62% | 22 | 73 | 33% |
| Oct 12–18 | ~116 | 74 | 109 | 60% | 49 | 60 | 64% |
| Oct 19–25 | 141 | 68 | 111 | 62% | 31 | 80 | 48% |
| Oct 26–Nov 1 | 141 | 57 | 193 | 77% | 116 | 77 | 40% |
| Nov 2–8 | 126 | 67 | 106 | 61% | 36 | 70 | 53% |
| Nov 9–15 | 106 | 43 | 85 | 66% | 30 | 55 | 41% |
Stored AIR Matrix residential weeks only; missing weeks are omitted, never filled. November 2–8 was already stored and is included without creating another issue. ~ means about. From October 19–25, counting uses method v2; comparisons with earlier weeks need that context. Sales ÷ new listings is not a cohort conversion rate.
106 new home listings, 43 sales, 30 expired and 55 cancelled: 85 came off unsold. The non-sale rate was 66%, and sales ÷ new listings was 41%.
Houses (SFD + acreage): 20 sales; median price $772,500; median Sale-to-List Ratio 95.3%; median days on market (this listing) 74.
Townhomes + half-duplex: 8 sales; median price $672,250; median Sale-to-List Ratio 96.7%; median days on market (this listing) 82.
Condos: 11 sales; median price $420,000; median Sale-to-List Ratio 95.3%; median days on market (this listing) 101.
Manufactured / park homes: 4 sales; median price $317,750; median Sale-to-List Ratio 94.6%; median days on market (this listing) 76.
Price bands: under $500,000 — 11 sales; $500,000–$750,000 — 19; $750,000–$1 million — 5; $1–$1.5 million — 4; $1.5 million and up — 4.
Under $750,000 accounted for 30 of the 43 sales.
"Priced right: 29 days. Needed a price cut: 115 days."
The first price made the clear difference.
18 of 43 sales (42%) never changed price. They sold at a median 95.8% of their first asking price in a median 29 days.
The other 25 (58%) needed at least one cut. They sold at 90.6% of their first price and took a median 115 days.
On a $700,000 home that gap is about $36,000, plus roughly three extra months of carrying costs.
These are median results among sold homes only. They do not establish that the starting price alone caused the difference or predict the result for every listing.
The market rewards the first price, not the second.
The non-sale rate was 66%, and 58% of sold homes needed at least one price cut. Most overpriced listings are either cutting or leaving.
Price to the comparable sales, not to the spring.
Ask us how homes in your neighbourhood and price range are selling.
Negotiating room is real, especially where listings have sat.
A typical sale came in about 4–5% below asking, with more room possible on listings that have already sat for 100+ days.
Under $750,000 is where the volume was: 30 of 43 sales. We would still compare each home with recent nearby sales before shaping an offer.
Graham Team Take
A four-day week, steady buyers, and sellers who priced right at the start did best. Watch the next two weeks. Expect late-November expiries and a pre-December slowdown.
Share this recap
What’s my street doing?
Get a free local report with recent nearby sales, current competition and what buyers are doing around your price range.
Get my street reportGraham Real Estate Team · Royal LePage Kelowna


Source: Royal LePage Kelowna board snapshot (all property classes) and Association of Interior REALTORS® Matrix MLS®, Central Okanagan, residential only. Sales counted by sold-reported date, Nov 9–15, 2026. Data pulled Nov 18, 2026. The Association of Interior REALTORS® assumes no responsibility for its accuracy.
Graham Real Estate Team · Royal LePage Kelowna. Non-sale rate = expired plus cancelled listings divided by sales plus expired plus cancelled. Weekly totals and residential details come from the sources named above.
Get the Market Pulse in your inbox
The Central Okanagan numbers, once a month. Weekly figures are published free on our Market Pulse page. Confirm your email once and you're in.